Blog
Reading the future, meaningfully: The Corruption Risk Forecast

Do you remember the 2008 economic crisis? Greece was particularly badly hit. Not only did Greek debt prove to be unsustainable, but the crisis also revealed the systemic corruption afflicting the country. The problems had not been completely invisible prior to this: Greece had received critical evaluations from the Group of States against Corruption (GRECO), for example. But strangely, Greece had been performing well in the Corruption Perceptions Index (CPI) before the crisis.
Once the corruption of the past became known, and its impacts felt, experts rushed to downgrade Greece’s scores – just at the point when new governments and new leadership were actually working to fix the problems.
This proved that the major challenge in corruption studies was not only how to measure corruption in a specific and meaningful way, but also how to measure it across time, so as to capture change, not just reputation. We developed the Corruption Risk Forecast (CRF) for 120 countries, releasing it in 2019, as an answer to this problem, because if we cannot trace corruption across time no anti-corruption policy can be evaluated.
The difficulties of evaluating anti-corruption tools
For many years, I was among the few academics responding to the challenge launched by the even fewer policymakers who wanted evidence of what worked (and didn’t work) in the anti-corruption arsenal. By 2010 my team had evaluated existing top-level mechanisms and governance models for the Norwegian Agency for Development Cooperation (NORAD), including the ratification of the United Nations Convention Against Corruption (UNCAC). We found that countries that had ratified the Convention (about half the world) had not recorded more progress than those that had not.
Later, consulting for the Swedish International Development Cooperation Agency (SIDA), we looked at more anti-corruption tools: anti-corruption agencies, conflict of interest regulation, freedom of information acts, and so on. Two major issues hindered our efforts to evaluate them. First, we had to use as the ‘dependent’ variable over time a perception aggregate, either CPI or the Control of Corruption indicator from the World Bank.
These instruments were not suited for tracing corruption over time, nor were they suited to evaluation purposes. They lack specificity, meaning that even when something changes it is hard to know what changed – and the time lag inherent in these measures makes it harder still. Also, since these measures are statistical aggregates they display little variation across time, and the statistical aggregation method of the various individual sources on corruption means that any change they do signal often falls within the margin of error.
The second obstacle to effective evaluation was the lack of country context. No anti-corruption intervention should be assessed without an understanding of the broader factors that shape corruption, as corruption is the expression of a governance context. In my earlier assessments I used the Human Development Index as a measure of a country’s level of modernity, with modernity serving as a proxy for the governance context.
The problem with this approach was that modernisation is not external to corruption: they influence and reflect one another. For instance, a country should only be considered modern when it has a bureaucracy autonomous from private interest; and patrimonial countries may have skyscrapers, but they are not modern if the ruler uses the state budget as his own. Corruption and development influence one another, it’s not just a one-way street, meaning ‘modernity’ is not a sufficient measure of context when it comes to corruption.
The IPI: breaking down – and measuring – control of corruption
We needed a model of the main factors directly determining control of corruption. In 2016 I pulled these factors together as the Index for Public Integrity (IPI).18a9065ca75d The IPI conceived corruption as a balance between constraints (legal and normative) and resources (power discretion and material resources). The single composite score is based on an assessment of six national-level proxy indicators:
- Budget transparency
- Administrative transparency
- Online services
- Judicial independence
- E-citizenship (a measure of broadband subscriptions and internet users)
- Freedom of the press.
These apparently disparate components come together remarkably well in a principal component analysis, as they measure one latent variable – control of corruption – and thus prove highly
As the IPI score for each country is normalised on a 1–10 scale for ease of analysis (10 representing the highest integrity), the comparison across time presents the same issues as other aggregate indexes. We thus prefer to use aggregate IPI scores to compare across countries and not over time.
We decided it would be valuable to track the individual components of IPI over time, not just the aggregate. By doing so, one could know exactly which indicators progressed, which stagnated, and which regressed, bringing us closer to a full ‘diagnosis’ of country trends and turning the lack of a single score to an advantage.
Enter, the Corruption Risk Forecast (CRF).
The CRF: finding and explaining corruption trends
The CRF is an analytical rather than a measurement tool, designed for corruption risk analysis and evaluation purposes. In the first step to creating the forecast, we assess the IPI’s country trend for consistency, to ensure that we capture the whole and not just isolated parts. We consider a time interval of ten years; in that period, a country needs to change significantly in two or more IPI indicators in one direction, and none in the opposite one, for its change to be recorded.
The second, qualitative step is to solve inconsistent cases (say, three indicators in the positive and one in the negative) and update the data for all the cases. The ten-year time series has a time lag, and events might take place beyond the latest data point that subvert long-term trends. The unpredictable can always strike, for example Burkina Faso and Ukraine both showed improving trends when unforeseen coups or wars (respectively) set them back.
The methodologies for both IPI and CRF can be found on our website.
The Corruption Risk Forecast (CRF)
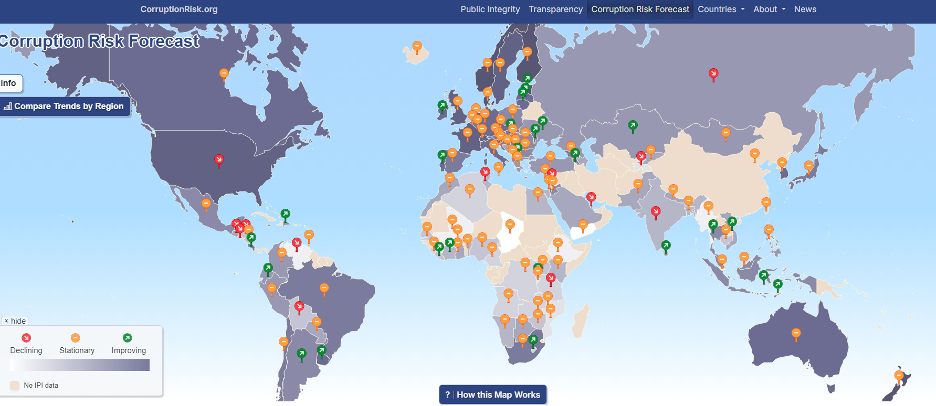
A screenshot of the Corruption Risk Forecast. The CRF landing page provides an at-a-glance view of 140 countries’ anti-corruption trends: declining (red), improving (green) or stationary (amber).
Credit: © Alina Mungiu-Pippidi by-nc-nd
The result is a transparent trend diagnosis of a country. Where is this country and why? Will this or that anti-corruption tool give results next year? As an analytical tool, the CRF can be used for ex-ante as well as ex-post evaluation of anti-corruption policies and tools.
The components provide the context against which any individual anti-corruption tool can be assessed: if judicial independence has significantly declined the judicial measures will not work; if freedom of expression has shrunk significantly one can hardly expect any whistleblower law to perform.
Where these indexes are taking us
Anti-corruption tools operate in a broader context, not in a vacuum, and the evaluation of any given anti-corruption intervention should use the background controls offered by the CRF. We see in the data that the world has not progressed on anti-corruption, despite the technological advances on which we all pin our hopes (and which reduce opportunities for corruption), because these tech advances were offset by bad politics. Press freedom and judicial independence, the two key corruption ‘constraints’ components, have mostly declined or stagnated in those countries most in need of improvement.
To date, the CRF has been used mostly by governments and intergovernmental organisations, but the data (and our contact details) are available to all. Some US businesses also expressed interest in the project, including in acquiring it, but as academics we are reluctant to create a paywall. We hope for even more evidence-based anti-corruption in the future, and not just of the ‘let’s show them we do something’ kind that is still so frequent in anti-corruption policy.
The IPI and CRF complement one another: the IPI being used for comparisons between countries and the CRF for trend analysis over time. Freely available to all, any analyst or anti-corruption reformer, or any investor looking for a destination, can find both the trend of a country and its explanation. They can use these tools to answer their own research questions, whatever they may be, and analyse what works in their own context.
Anti-corruption measurement series
This blog series looks at recent anti-corruption measurement and assessment tools, and how they have been applied in practice at regional or global level, particularly in development programming.
Contributors include leading measurement, evaluation, and corruption experts invited by U4 to share up-to-date insights during 2024–2025. (Series editors are Sofie Arjon Schütte and Joseph Pozsgai-Alvarez).
Blog posts in the series
- One year on: The Vienna Principles for the measurement of corruption (Elizabeth David-Barrett) 2 Sep 2024
- Measuring progress on Sustainable Development Goal 16.5 (Bonnie J. Palifka) 1 Oct 2024
- Pitfalls in measuring corruption with citizen surveys (Mattias Agerberg) 11 Nov 2024
- Decoding corruption: using the DATACORR database to design better survey questions (Luís de Sousa, Felippe Clement, Gustavo Gouvêa) 25 Nov 2024
- Can we standardise global corruption measurement? (Salomé Flores Sierra Franzoni) 12 Dec 2024
- Assessing the quality of corruption surveys for SDG 16.5 monitoring and beyond (Giulia Mugellini) 27 Jan 2025
- The Unbundled Corruption Index (UCI): Prototyping a multi-dimensional measure (Yuen Yuen Ang) 4 Mar 2025
- (This post) Reading the future, meaningfully: The Corruption Risk Forecast (Alina Mungiu-Pippidi) 31 Mar 2025
Sign up to the U4 Newsletter to get updates, or follow us on Linkedin.
- There is no connection between IPI and the defunct Global Integrity index. The latter was created in the US, and its methodology leaned heavily on anti-corruption regulation. The NGO Global Integrity suspended the index when it was noted that there were large discrepancies between corruption and the quantity of regulation by country. (We have an old Roman saying that the most corrupt Republic has the most laws!)
Disclaimer
All views in this text are the author(s)’, and may differ from the U4 partner agencies’ policies.
This work is licenced under a Creative Commons Attribution-NonCommercial-NoDerivatives 4.0 International licence (CC BY-NC-ND 4.0)
